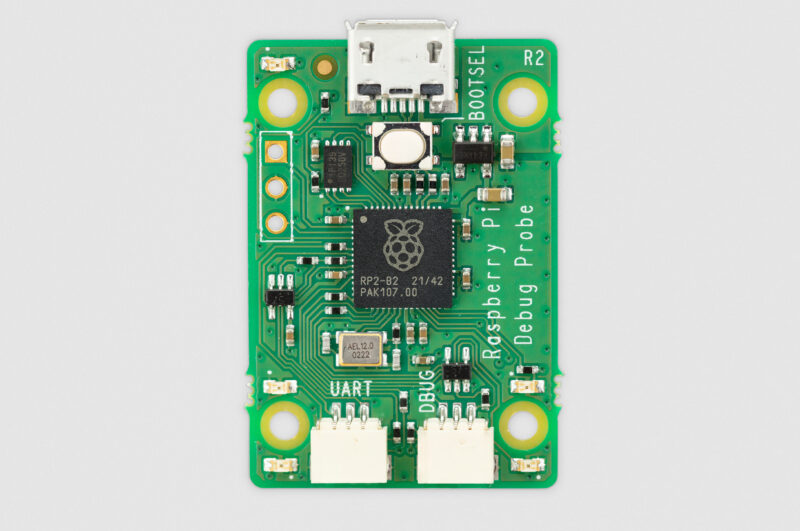
Since the launch of Raspberry Pi Pico and RP2040 microcontroller in January 2021, individuals have been utilizing one Pico to debug programs on another. In response to this trend, the Raspberry Pi Foundation has announced the release of the Raspberry Pi Debug Probe. The Debug Probe is a comprehensive hardware debugging solution for Arm-based microcontrollers, powered by RP2040, and is available at a cost of only $12.
The Raspberry Pi Debug Probe provides:
- A USB to Serial Wire Debug (SWD) bridge
- A generic USB serial adapter
- Cables to connect to a host computer, and to the debug target
It was designed with Raspberry Pi Pico, and other RP2040-based targets, in mind, but the Raspberry Pi Debug Probe can be used to debug any Arm-based microcontroller that provides an SWD port with 3V3 I/O.
Bugs, not features!
For those who enjoy writing computer programs but dread the process of bug hunting, a debugger is an essential tool. While most debuggers provide a common set of basic capabilities such as single stepping, breakpoints, and inspection of variables and memory, the way in which these capabilities are offered varies depending on the programming language and operating environment being used.
Individuals who write programs using high-level interpreted programming languages such as Python have access to debug capabilities that are built directly into the runtime environment. On the other hand, those who write programs using low-level compiled programming languages such as C may require a debugger like gdb to interact with their program while it runs on an operating system like Linux.
However, when a C program is running without an operating system directly on the processor (referred to as bare metal operation), or when writing an operating system, accessing the debug capabilities built into the processor itself becomes necessary. In such cases, a debug probe is required to facilitate this access.
What on earth is a debug probe?
In essence, a debug probe provides a bridge between USB and the SWD protocol, allowing a host to access the target’s debug port.
All modern Arm-based microcontrollers, including RP2040, are built with Arm’s CoreSight debug architecture. Each processor core, such as the Cortex-M0+ utilized in the RP2040, has an Access Port (AP) that allows single stepping, setting breakpoints, monitoring processor register values, and accessing memory and peripherals via the processor’s bus interface.
The microcontroller itself is equipped with a Debug Port (DP), which is externally connected to the pins on the package and internally connected to each AP in the system. RP2040 features a low-pin-count Serial Wire Debug (SWD) port that exposes its DP. By communicating the SWD protocol through this port, a host computer can control each core’s AP to debug a program running on the core.
A debug probe acts as a bridge between USB and the SWD protocol. While connecting to the target’s SWD port directly to the GPIO header on a Raspberry Pi is possible, a USB connection is much more convenient. For those using a PC or Mac, a USB connection is the only option.
The Raspberry Pi Debug Probe follows the Raspberry Pi Debug Connector Specification and exposes the SWD signals through a three-pin JST connector. Adapter cables are provided to connect without the need for soldering to a breadboard or to the debug connector on Raspberry Pi Pico H and WH.
Arm has standardized the protocol used to communicate over USB between a host computer and a debug probe. The Raspberry Pi Debug Probe is compliant with this CMSIS-DAP standard and can work with numerous debug software platforms, including OpenOCD, which is the preferred choice.
Serial monitor
Establishing a serial console connection between a microcontroller target and a host computer is often desirable for interacting with software running on the target and retrieving diagnostic data. If the host computer is a Raspberry Pi, one of the UART peripherals exposed via the GPIO header can be used. However, for those using a PC or Mac, access to a built-in serial port is unlikely.
The Raspberry Pi Debug Probe acts as a USB serial adapter and uses the same USB connection as the SWD bridge. It exposes the UART signals through a second three-pin JST connector that follows the Raspberry Pi Debug Connector Specification.
For individuals who do not require debug functionality, the Raspberry Pi Debug Probe’s low cost makes it an affordable alternative to other USB serial adapters. It could replace the once-ubiquitous FTDI cable as your adapter of choice!

Gladstone is a tech virtuoso, boasting a dynamic 25-year journey through the digital landscape. A maestro of code, he has engineered cutting-edge software, orchestrated high-performing teams, and masterminded robust system architectures. His experience covers large-scale systems, as well as the intricacies of embedded systems and microcontrollers. A proud alumnus of a prestigious British institution, he wields a computer-science-related honours degree.